Sunday, April 6, 2014

Rock and Soil Types

3 Types of Rocks:

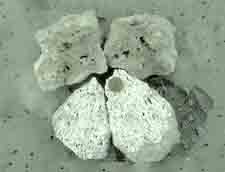
- Igneous Rocks - This type of rock is formed by the cooling and solidifying of molten materials. These types of rock can be found beneath, or at, the Earth's surface as lava. An example of this type of rock is Pumice. Pumice is a light and porous rock formed by explosive volcanic eruptions. Below is a picture of Pumice.
Pumice

- Metamorphic Rocks - A metamorphic rock is a rock that was once in one form and changed to another due to the exposure to eat, pressure, or some other experience. This process is called metamorphism. Much of the Earth's crust is made up of metamorphic rocks. Marble is a prime example of a metamorphic rock. Marble is composed of recrystallized carbonate materials, mostly dolomite or calcite. Below is a picture o marble.
 An irregularly shaped rock, milky-white in color. The rock glistens or sparkles from the overhead lights.

- Sedimentary Rocks - This type of rock comes from the deposition and solidification of sediment. These rocks are often found in layers and commonly contain fossils. The Earth's crust is estimated to contain about 8% sedimentary rock. The study of this type of rock can provide useful information for civil engineers. An example of this rock would be Sandstone. Sandstone is a Clastic sedimentary rock formed mostly of sand-size minerals and rock grains. Below is a picture of Sandstone.


Types of Soils:
Gelisols, Histosols, Spodosols, Andisols, Oxisols, vertisols, aridisols, Ultisols, Mollisols, Alfisols, Inceptisols, Entisols

Tuesday, April 1, 2014

Maps Lab

In learning about maps the four we focused on were the choropleth, dot density, proportional symbol map and isopleth.

Choropleth Map:

Areas on a Choropleth map are shaded or patterned in order to differentiate the proportion of statistics the map is based off of. This type of map makes it easy to visualize the different proportions of studies over a geographic area on a big scale and also can bode easy for visualizing a region on a smaller scale. Below is an example of a Choropleth map.


Dot Density Map:

This type of map uses the dot symbol to give a visual example of a feature or phenomenon on a map. The heavier the dots in a given area, the greater the density of that feature. One dot can represent one unit or a single dot can represent many units. Below is an example of a Dot Density Map


Proportional Symbol Map:

These maps are used to represent Geographical data. The data is scaled proportionally and placed next to it's corresponding geographic location. One problem with these maps is that cartographers are not entirely sure viewers can decipher the size difference between values. Below is an example of a Proportional Symbol Map.


Isopleth Map:

This type of map shows data in a third dimension. For this reason most of these maps are used to show things such as elevation. This third dimension is shown by a series of lines called isopleths. Below is an example of an isopleth map.

Barometer Lab

For this lab we used homemade barometer to measure the pressure in the atmosphere. The purpose of the lab was to determine the pressure changes according to the different changes in weather.

In order to make the barometer we cut a balloon's top off and stretched the remainder of the balloon over a glass bowl. Once this procedure was done we cut a straw at the top into a pointed tip in order to read what I was pointing at. Then this pointed straw was taped to the top of the balloon covered glass bowl. Using the graph below, the atmospheric pressure on a given day could be recorded.

Based on the picture above of the homemade barometer on this given day, the atmospheric pressure is .8 ATM.

Pressure (ATM) Ruler Reading (mm)
0.80 5
0.85 10
0.90 15
0.95 20
1.00 25
1.05 30

Monday, March 17, 2014

Sunflower diary

Day 36:

My sunflower now has four leaves. The bottom two are curling significantly and I'm not exactly sure if that indicates thirst or anything like that. The sunflower stem is nearly 10 inches long and can not stay straight by itself. I am still toying with the idea of making some sort of stilt for it, I just am not sure if that will do more harm to the health of the plant than help. 


Sunflower diary

Day 25:
 My sunflower is growing very fast. The original stem has sprouted into some more leaves. As the stem gets longer the plant is beginning to lean. I may need to get some more soil for it or possibly give it something to help it grow straight. 


Thursday, February 27, 2014

Day 16: My sunflower made some significant changes almost overnight. Between the two leaves at the top of my plant sprouted what seems to be the beginning of an extension of the stem. I am no sunflower expert so for all I know it could soon open up to a big flower. Below is a picture of my plant, as you can see it is nice and happy sitting in the sun.

Monday, February 24, 2014

Sunflower diary

Initially I was very skeptical on whether or not my sunflower seed would ever sprout. I left on Thursday morning in order to go to Detroit with my lacrosse team for the weekend. When I returned my seed had still not sprouted at all. This was about 6-7 days in. A few days later, day 10, my sunflower showed signs of life and popped out of the soil!

Day 10: My sunflower popped out about an inch. The soil looked a little more dry than usual and I would imagine that the little guy was very thirsty.